

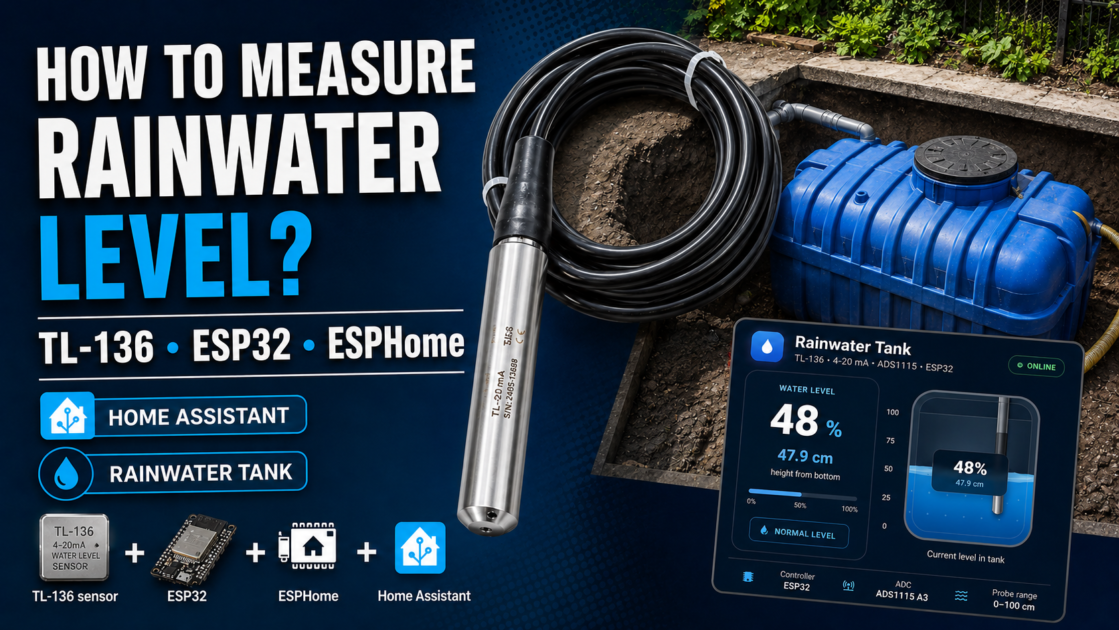

How I Built a Reliable Rainwater Tank Level Sensor for Home Assistant: TL-136, 4–20 mA, ADS1115 and ESPHome
A tank level sensor sounds like a simple project until the number on the dashboard has to be trustworthy enough to protect a pump and make irrigation decisions. I wanted more than a nice percentage on a screen. I wanted a measurement chain I could verify with a tape measure, diagnose with a multimeter, and later use as one of the inputs for an autonomous garden irrigation controller. This article documents that build from the hydrostatic probe all the way to ESPHome and Home Assistant.
a manual measurement showed 48.0 cm of water from the physical bottom of the tank. The hydrostatic reading represented roughly 42.7 cm above the probe diaphragm, while the probe itself sat about 5.3 cm above the bottom. Adding the installation offset brought the calculated level back to approximately 48.0 cm.
That validation is the core of the project. A Home Assistant entity can display almost any value we calculate, but that does not automatically make it physically meaningful. I wanted the final sensor to be useful later for low-water protection, irrigation permissions, alarms, pump logic and trend analysis — so the measurement had to survive a very ordinary test: put a tape measure into the tank and compare the result.

What I am actually building
The TL-136 does not send a message saying “the tank contains 48 cm of water.” It is an industrial-style hydrostatic transmitter. Water pressure at the sensing diaphragm changes with the height of the water column above it, and the transmitter represents that pressure as a 4–20 mA current-loop signal.
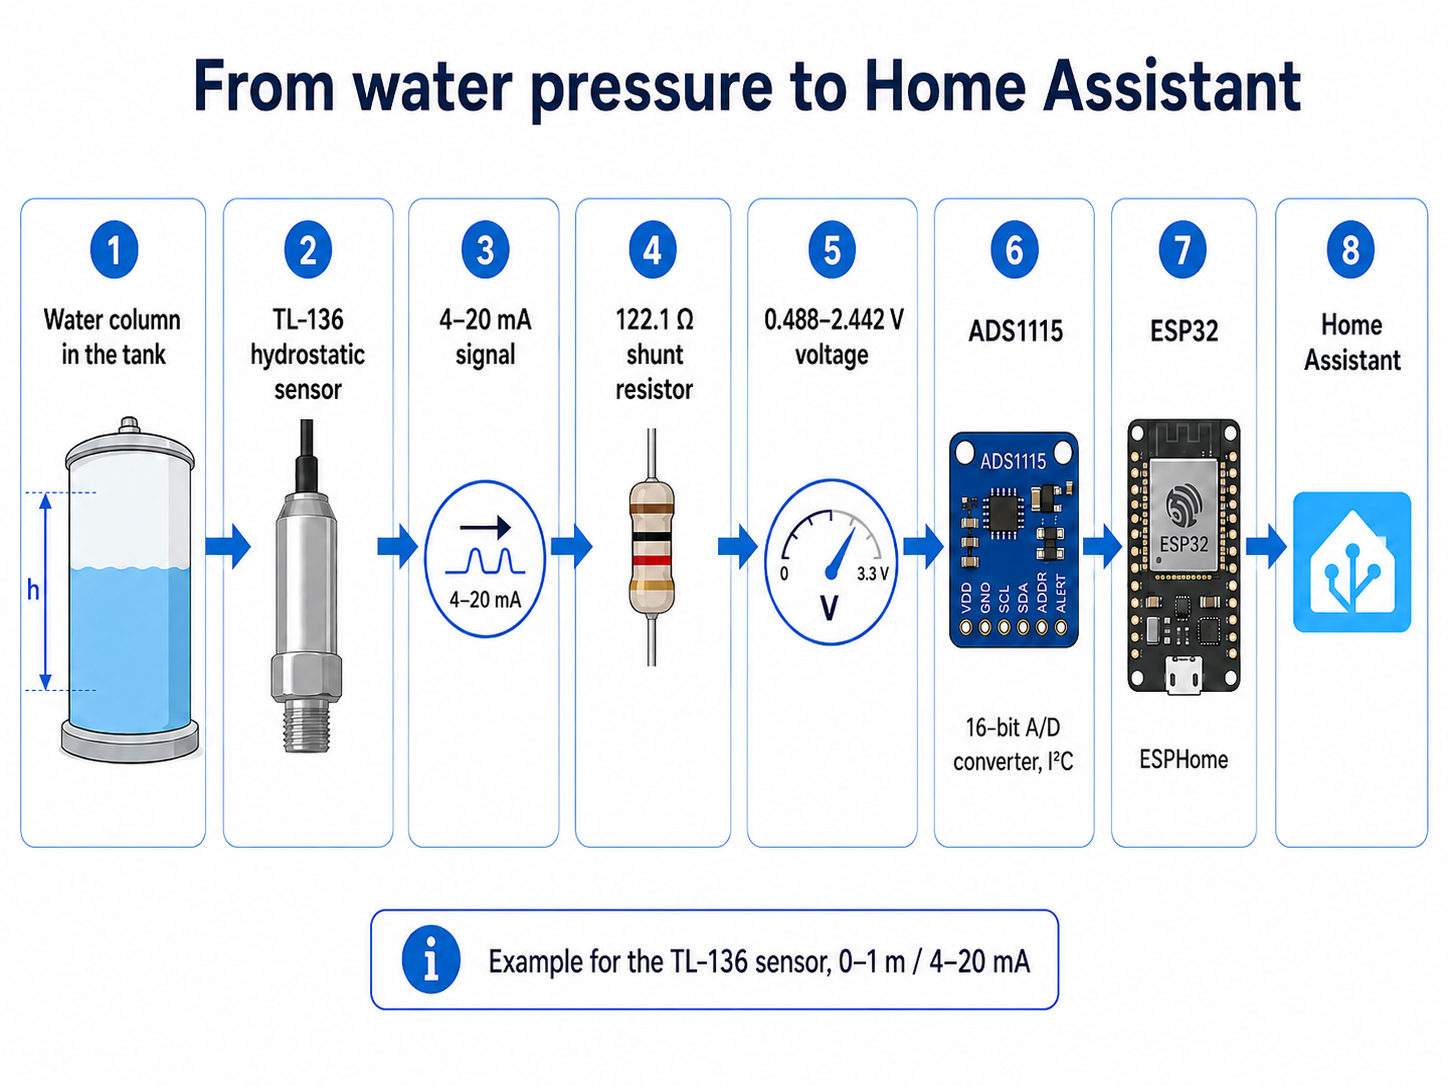
The rest of the electronics converts that industrial signal into something an ESP32 can use. The complete path in this build is:
water pressure → TL-136 → 4–20 mA current loop → 120 Ω shunt resistor → ADS1115 → I²C → ESP32 → ESPHome → Home Assistant
A small 0.96-inch OLED is connected to the same controller as a local diagnostic display. It is deliberately not the final user interface. The finished irrigation controller is planned around a larger colour TFT touchscreen, with the OLED serving only as a compact development and service display.
Parts used in this stage of the build
I am listing the actual building blocks because “connect a 4–20 mA sensor to an ESP32” hides most of the useful detail. The probe needs its own supply, the loop current has to be converted to voltage, the ADC needs a sensible input network, and the microcontroller still has to translate the resulting voltage into a real water level.
| Part | Used in this build | Purpose |
|---|---|---|
| Hydrostatic probe | TL-136, 0–1 m, 4–20 mA, 24 V DC | Measures hydrostatic pressure of the water column |
| Microcontroller | ESP32 DevKit / ESP-WROOM-32 | ESPHome, calculations and Home Assistant communication |
| ADC | ADS1115, 16-bit, 4-channel, I²C | Measures the voltage created by the loop current |
| Current-sense resistor | 120 Ω | Converts 4–20 mA into an ADC-friendly voltage |
| Series input resistor | 1 kΩ | Part of the ADC input/filter network |
| Filter capacitor | 10 nF | Simple low-pass filtering at the ADC input |
| Local display | 0.96″ SSD1306 OLED, 128×64, I²C | Shows level percentage plus diagnostic values |
| Probe supply | 24 V DC | Powers the TL-136 current loop |
the signal chain uses a single 120 Ω shunt resistor, and the ESPHome calculations use the same 120 Ω value. Keeping the hardware, formulas and YAML aligned makes later troubleshooting much easier.
Why I chose a 0–1 m TL-136 with a 4–20 mA output
My TL-136 is the 0–1 metre version. That range makes sense for a relatively shallow rainwater tank: I need roughly one metre of useful water-column measurement, not several metres of pressure range that would only reduce practical resolution.
The more important design choice, however, is the 4–20 mA output. The probe is not trying to send a tiny analogue voltage over a long outdoor cable, and I am certainly not extending I²C out into the garden. A current loop is a much more appropriate way to transport an analogue measurement between a wet outdoor location and electronics mounted elsewhere.
The cable route from the tank to the future controller is about 15 metres. The wiring was prepared as part of the installation so the tank sensor could become a permanent part of the irrigation system rather than a bench experiment. The TL-136 uses its own dedicated conductors; I do not mix its measurement pair arbitrarily with valve wiring.
The TL-136 cable contains a thin atmospheric reference tube. Do not cut it short, seal it, fill it with silicone or let water enter it. The dry end of the cable needs access to atmospheric pressure because that reference is part of how the hydrostatic measurement works.
Why add an ADS1115 when the ESP32 already has analogue inputs?
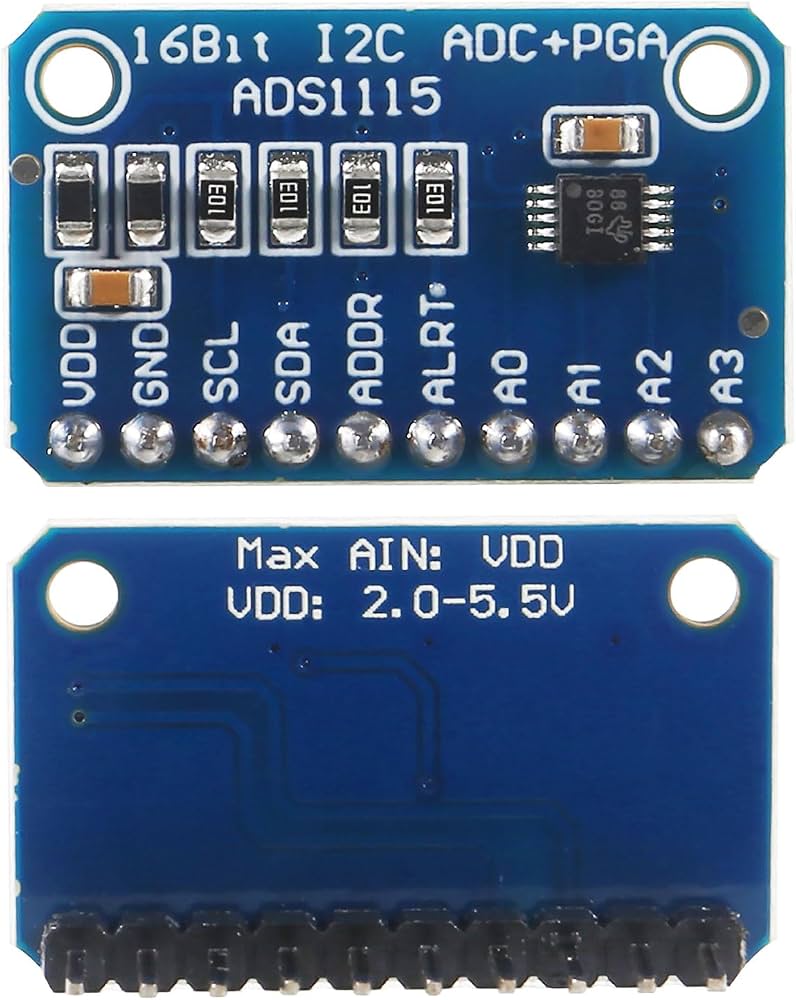
For this controller I wanted a separate and predictable analogue front end rather than treating the ESP32 ADC as the entire measurement system. The ADS1115 gives me a 16-bit converter, four analogue channels and an I²C interface that also leaves room for other analogue measurements later.
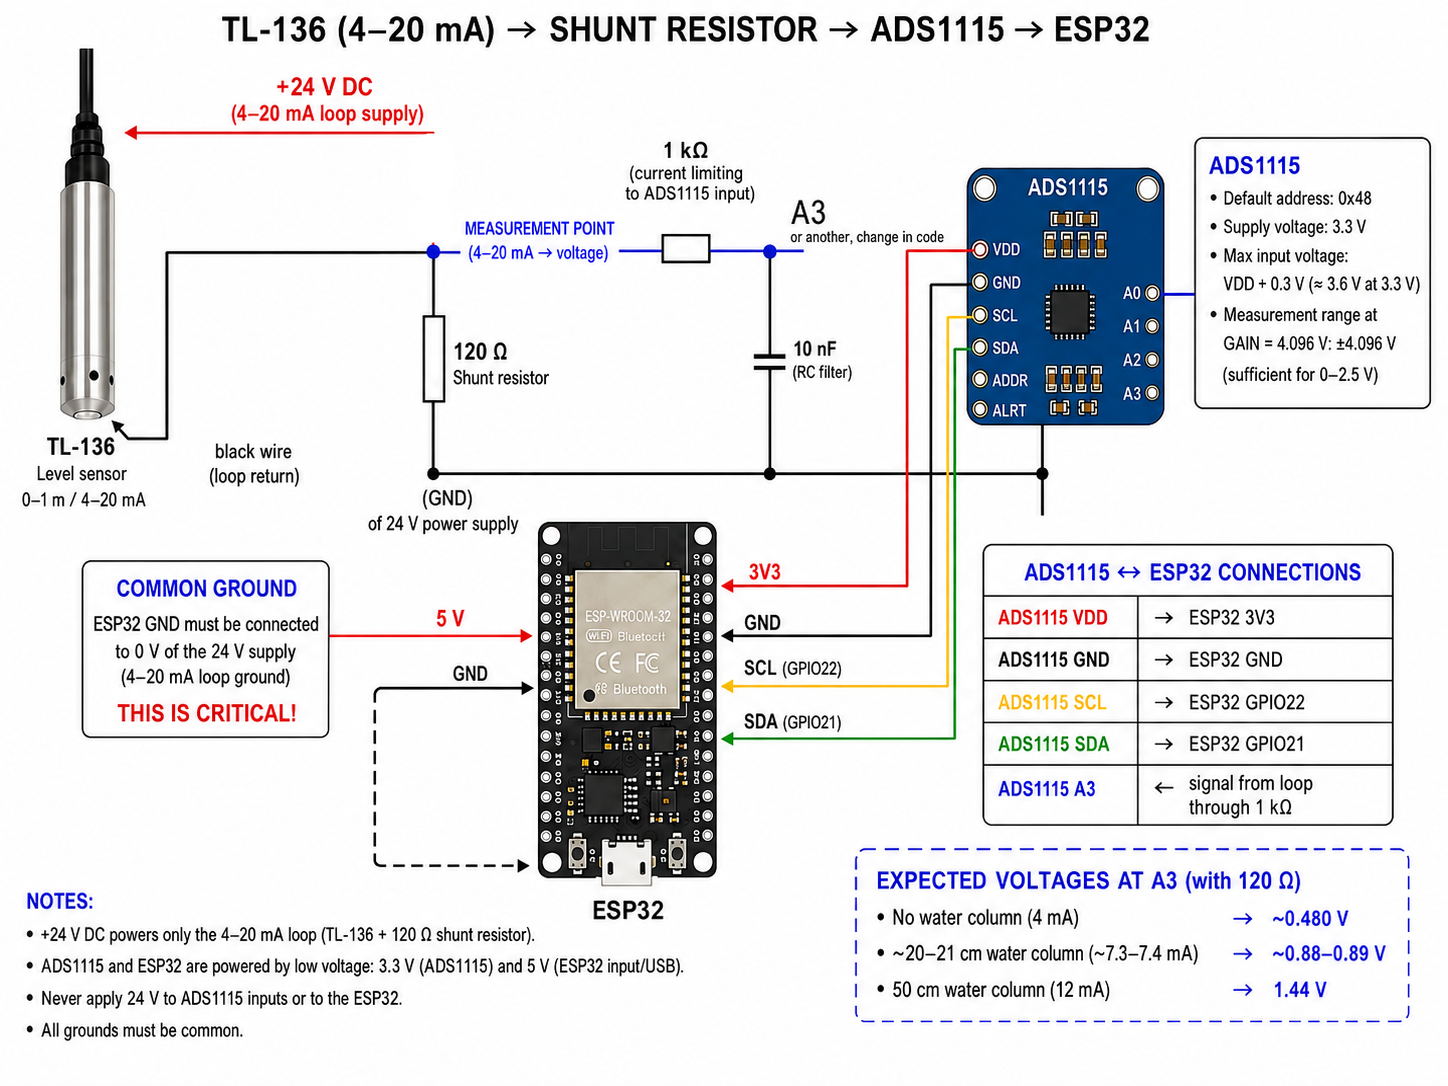
The ADS1115 appears at address 0x48. The SSD1306 OLED uses 0x3C, so both devices can share the same I²C bus. On this ESP32 I use GPIO21 for SDA and GPIO22 for SCL. The ADS1115 is powered from 3.3 V, and the TL-136 measurement is connected to the ADC as A3_GND.
The ADS1115 is still a voltage-measuring device. It does not directly “read 4–20 mA.” The loop current first flows through the 120 Ω shunt resistor. The voltage developed across that resistor is what the ADS1115 measures.
Turning 4–20 mA into a voltage the ADC can read
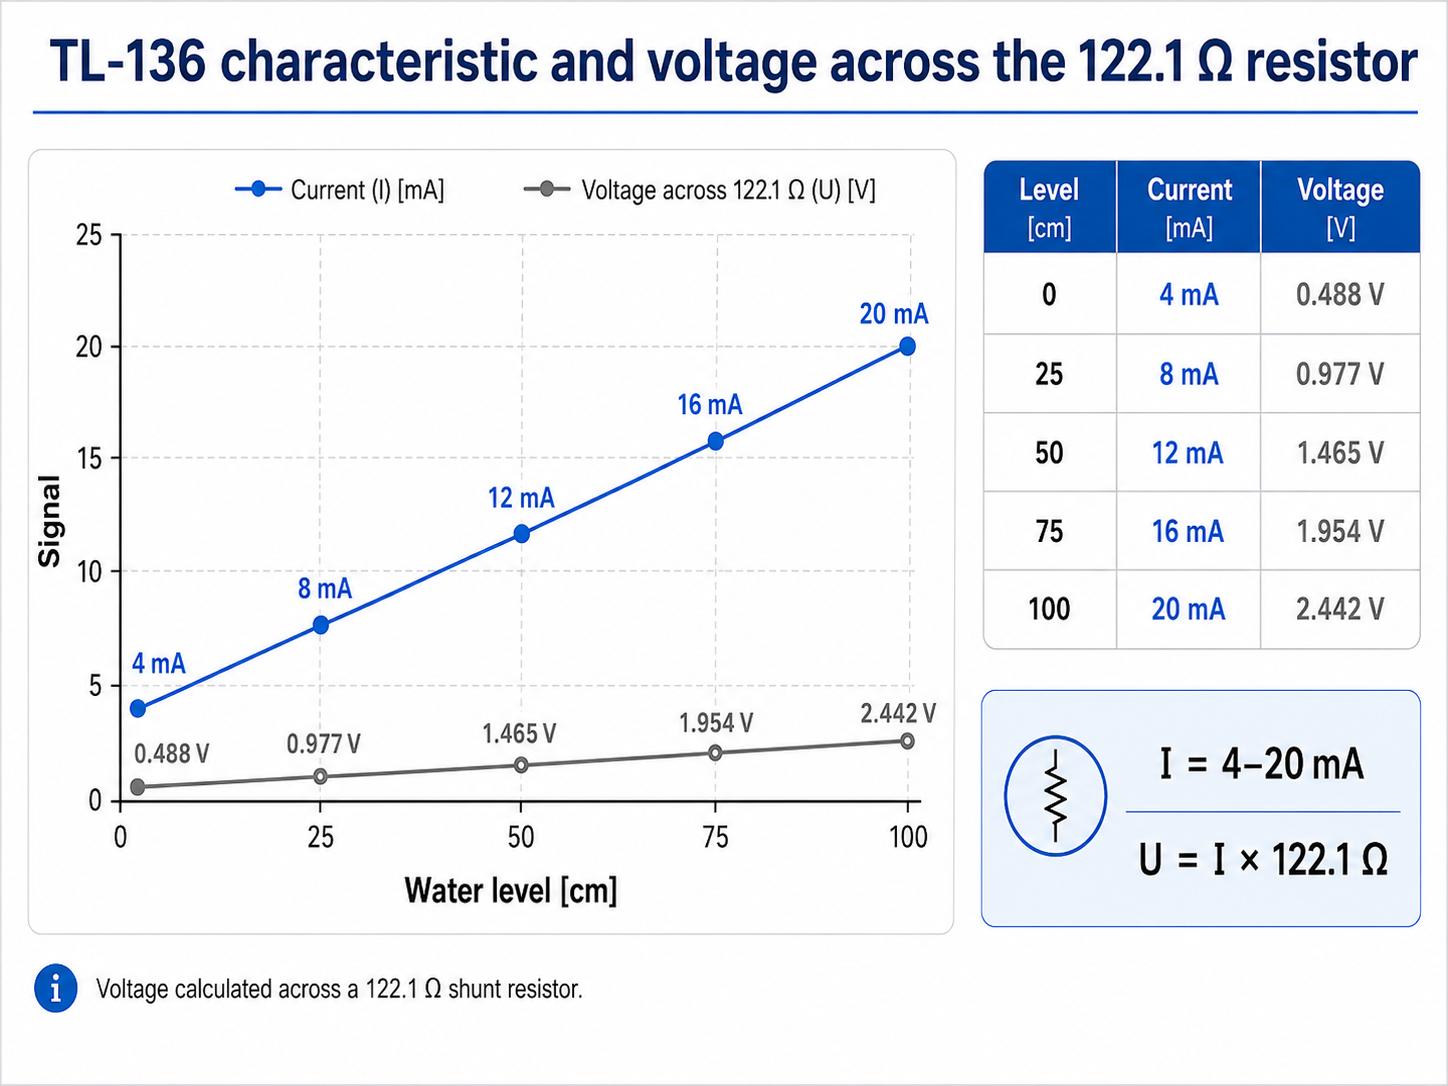
The electrical conversion is just Ohm’s law:
With a 120 Ω shunt:
That 0.48–2.40 V span is a comfortable range for the ADS1115 in this build. It also gives a very intuitive diagnostic check: if the probe is near the bottom of its range, I expect roughly half a volt across the shunt, not zero volts.
The wiring that matters: the ADS1115 is not placed in series with the loop
This is the point where a simple-looking 4–20 mA project is easiest to wire incorrectly. The ADS1115 does not become part of the current path. The current flows through the shunt resistor, and the ADC measures the voltage at the top of that resistor relative to ground.
+24 V DC
   |
   └──── TL-136 red wire
                  |
                TL-136
                  |
              black wire
                  |
                  ●  ← measurement node
                  |
                  ├──── 1 kΩ ───── ADS1115 A3
                  |                  |
                  |                10 nF
                  |                  |
                120 Ω              GND
                  |                  |
0 V supply ───────●──────────────────┘
                  |
                  ├──── ADS1115 GND
                  └──── ESP32 GND
The 24 V supply powers the TL-136 loop. The ADS1115 runs from 3.3 V, while the ESP32 can be powered from USB during development. In this non-isolated prototype the ADS1115 ground, ESP32 ground and the 0 V reference of the loop supply share the same electrical reference.
The 1 kΩ resistor between the measurement node and A3, together with the 10 nF capacitor from A3 to ground, forms a very simple input filter. Tank level is a slow signal, so there is no reason to chase millisecond response times. A little analogue filtering plus software filtering is useful rather than harmful here.
Before ESP32 and Home Assistant: verify the probe with a multimeter
I deliberately did not start by connecting everything at once. If the complete chain fails, “nothing works” tells you almost nothing. A better sequence is to verify the passive parts and the current loop first, then add the ADC, and only then add software.
1. Check the shunt resistor
The current-sense resistor is 120 Ω, so that is the number the formulas and ESPHome configuration are built around. Measuring the resistor before powering the loop is a quick way to catch a wiring mistake or the wrong component before it turns into a confusing calibration problem.
2. Check the zero-water end of the loop
At the bottom end of the TL-136 range, a 4 mA signal across 120 Ω should produce about 0.480 V.
That is a much more useful diagnostic result than immediately looking at a percentage in Home Assistant. If the loop is healthy, the electrical numbers should make sense before the software starts translating them.
3. Put the probe in a known water column
The next test used a small container with roughly 20–21 cm of water above the sensing point. For a water column around 20 cm, the expected current is approximately 7.2 mA, which should create a shunt voltage of about 0.864 V.
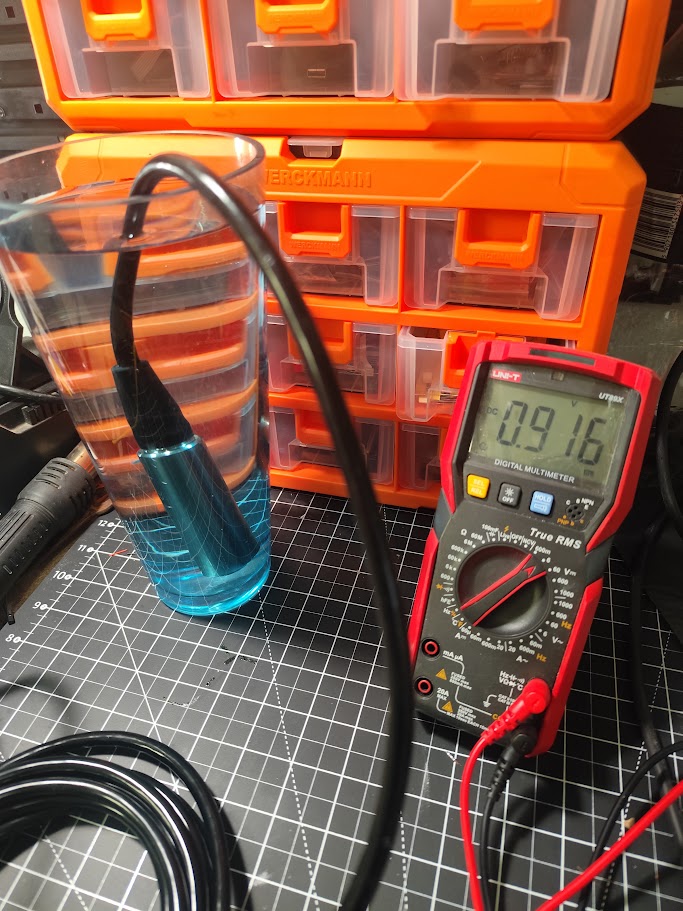
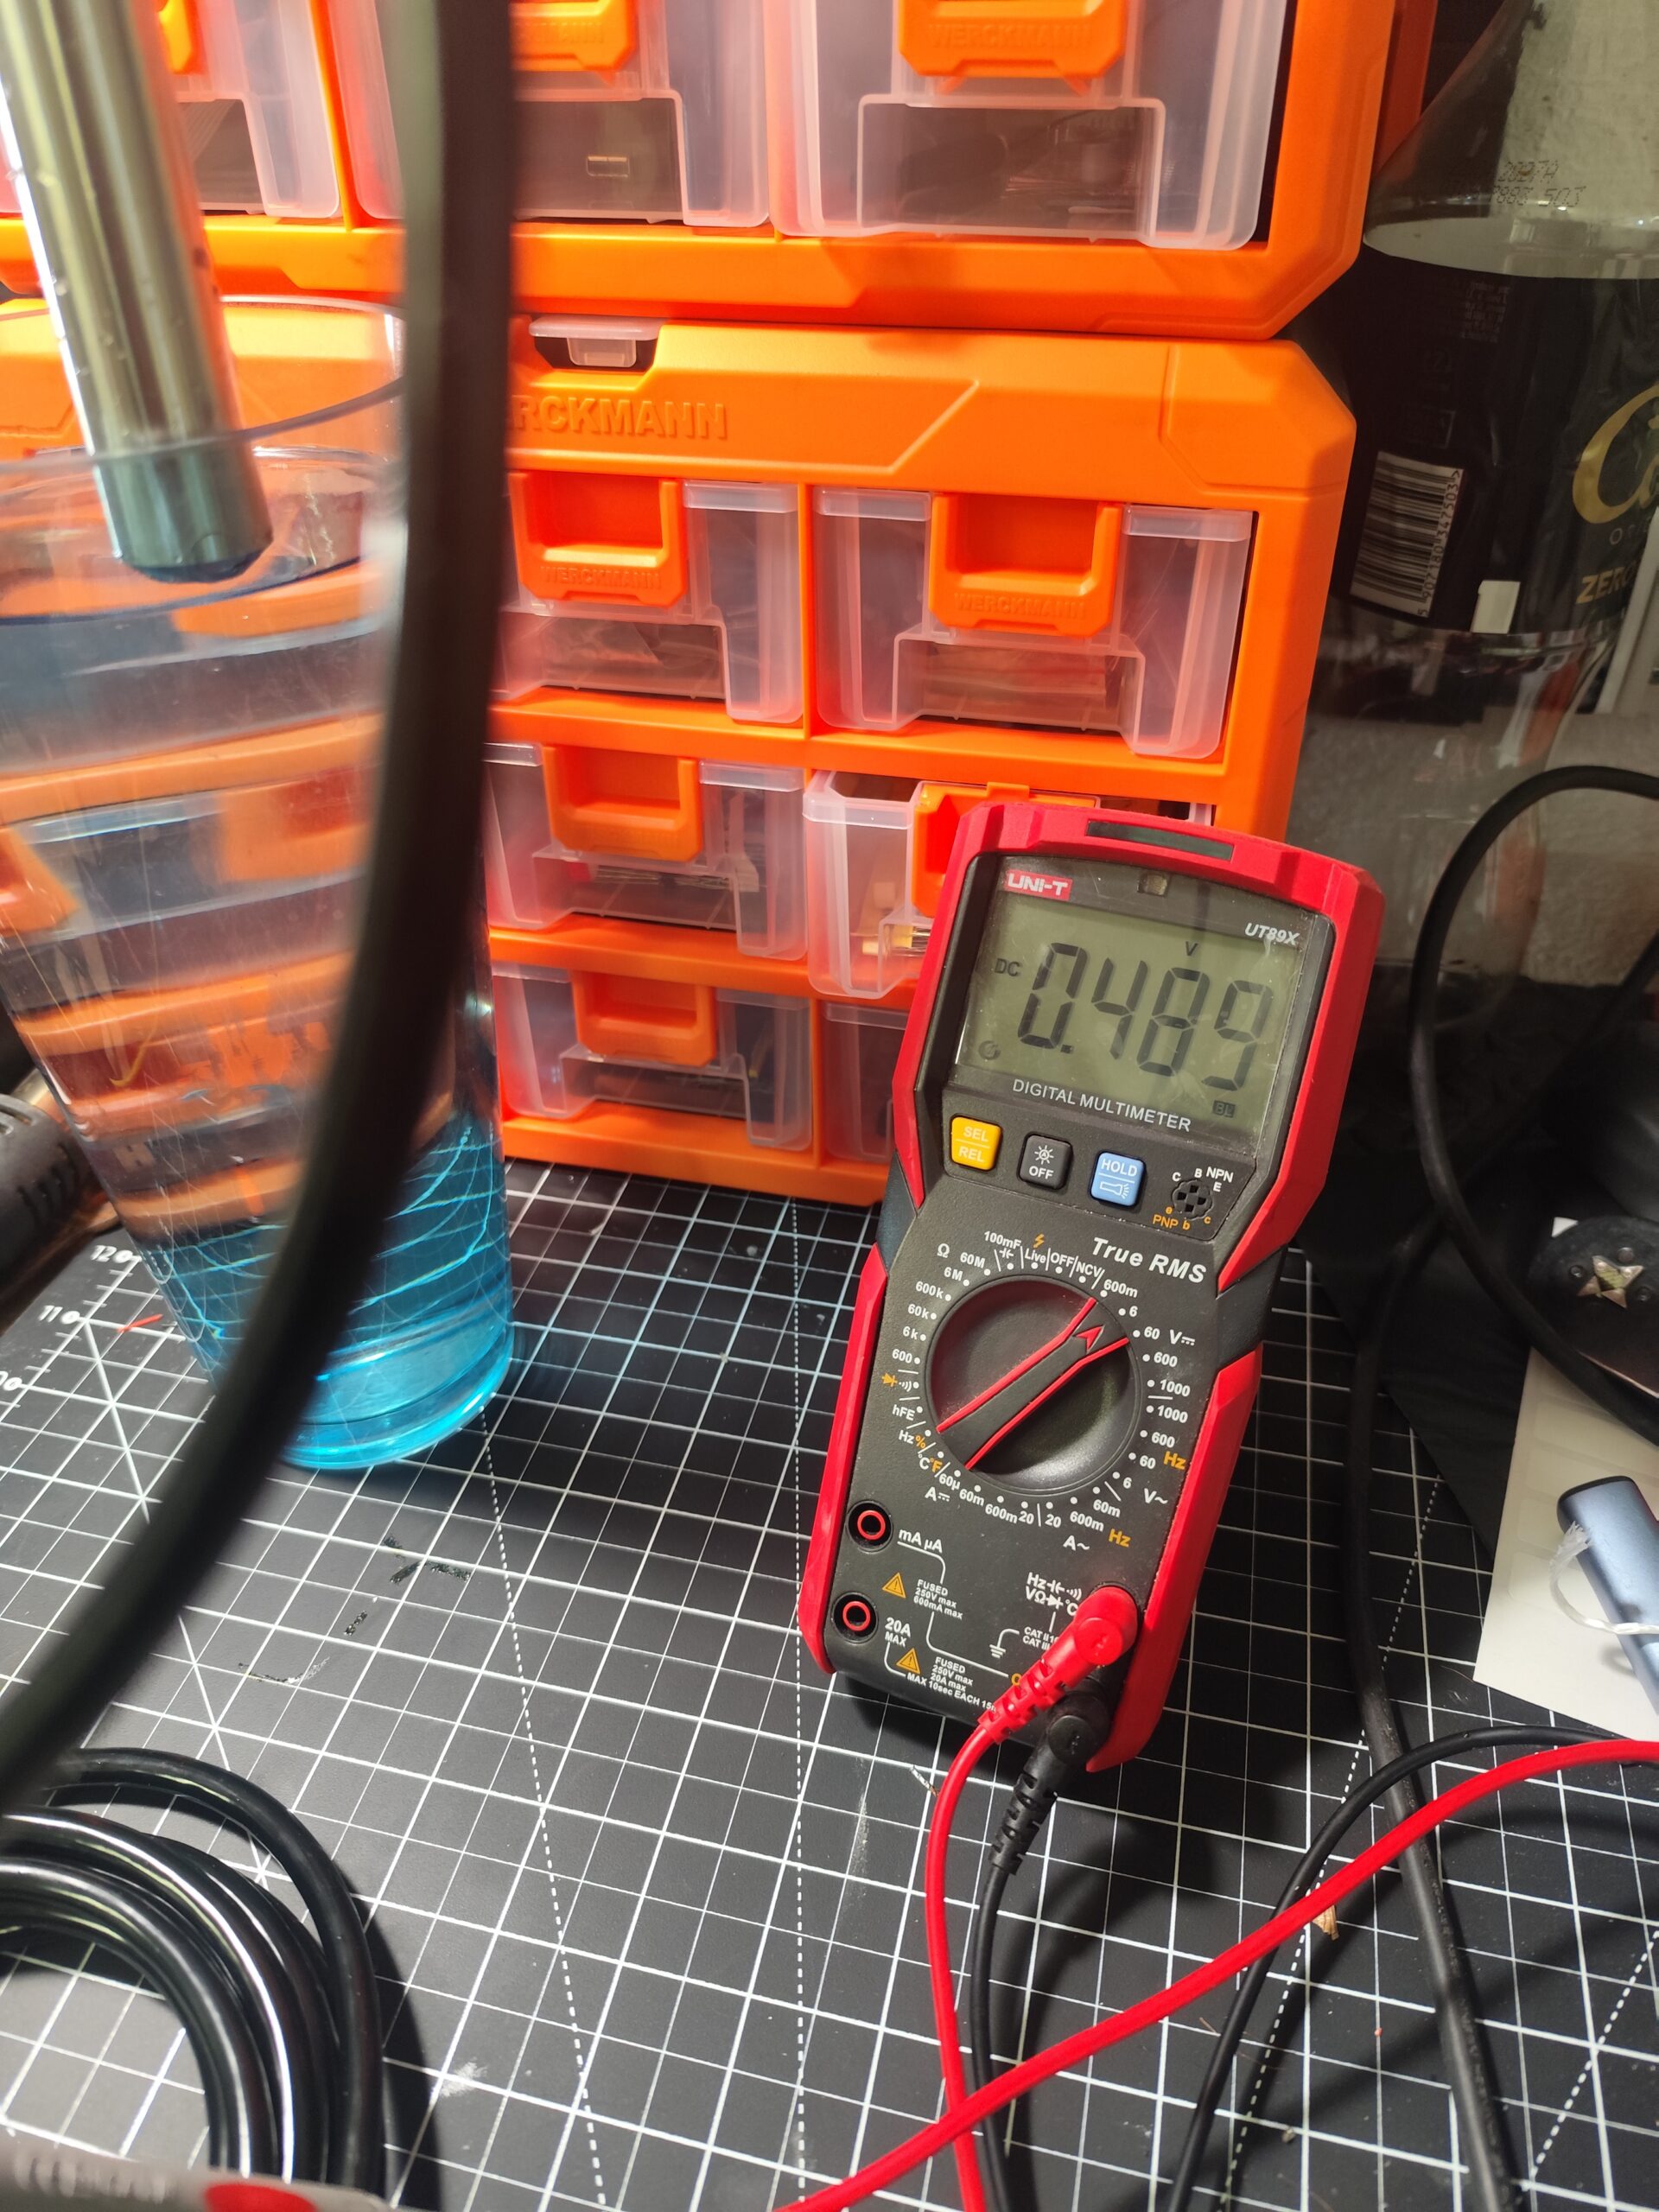
I ≈ 7.2 mA
V ≈ 7.2 mA × 120 Ω = 0.864 V
The exact result depends on the actual height of the water above the probe diaphragm rather than the height of the container itself. That distinction matters: the hydrostatic sensor responds to the water column above its sensing point, not to the dimensions printed on a bucket or tank.
do not judge this kind of analogue sensor from a single instant reading. Let the setup settle, repeat the measurement and compare the result against a known physical reference before changing calibration constants.
Bringing the ADS1115 and ESP32 online
Once the current loop behaved sensibly on the multimeter, I added the ADS1115 and ESP32. The I²C scanner then showed both devices:
Found device at address 0x3C
Found device at address 0x48
Here 0x3C is the SSD1306 OLED and 0x48 is the ADS1115. It is worth remembering that seeing an address in a scan is not a complete functional test. During one stage of the build the scanner could see the ADS1115 while the component still reported Communication failed. Fixing the physical connection solved that problem.
That is why I treat intermittent I²C behaviour as a hardware check first: wiring, contacts, power and ground come before rewriting YAML.
Why the finished measurement uses A3
In this particular prototype A0 did not give me a useful reading. Rather than spend the project chasing whether the issue was the input, a contact, a trace or the specific board, I moved the measurement to A3 and configured ESPHome for A3_GND. The reading became stable, so A3 is the channel I kept.
This is not a claim that ADS1115 A0 is generally unreliable. It is simply the path the real build took, and a useful reminder that a prototype has four analogue inputs for a reason: once one channel is verified and stable, the rest of the project can move forward.
The tank test: comparing electronics with a tape measure
Bench testing was useful, but the project only became convincing after the probe went into the real rainwater tank. The sensing point sits roughly five centimetres above the physical bottom. A more precise comparison between the electronic reading and a manual measurement gave an installation offset of about 5.3 cm.
That position is intentional. The very bottom of a rainwater tank is exactly where sediment can collect over time. I do not want the pressure probe resting directly in that layer, so the sensor is mounted slightly above it.
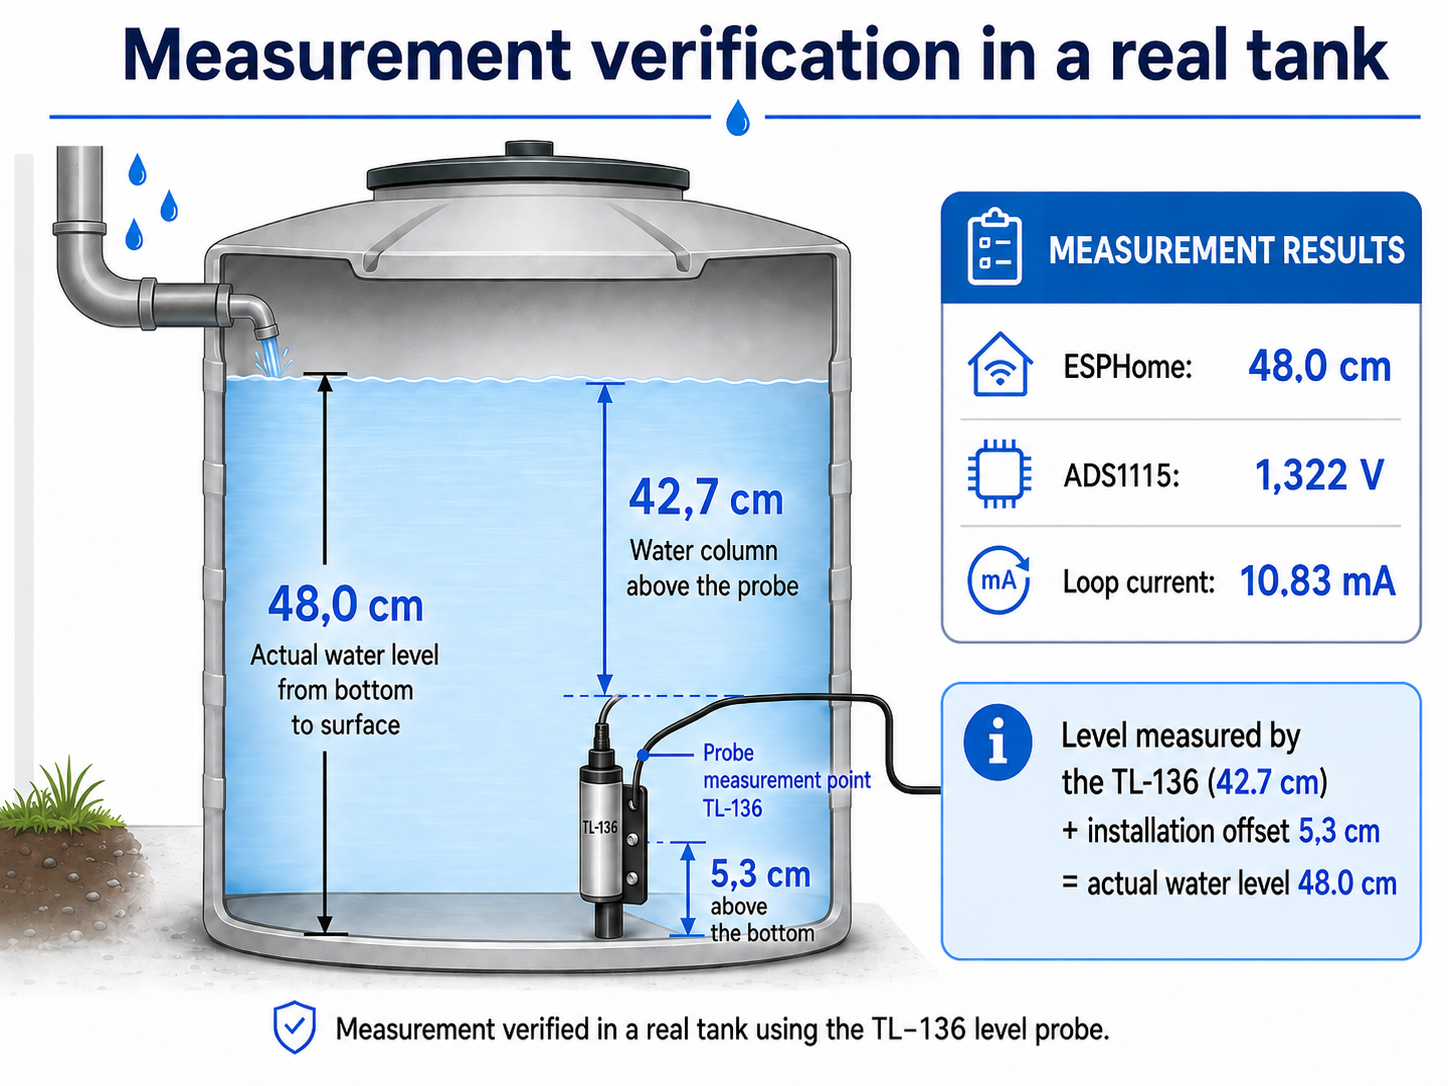
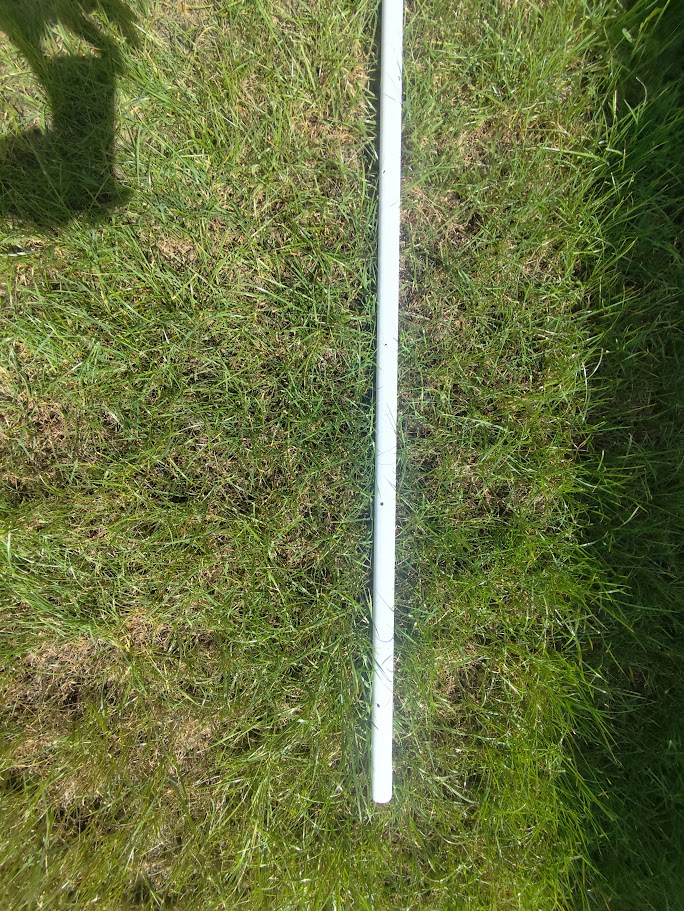
The manual tape-measure reading was 48 cm. That was the point where the measurement chain stopped being merely plausible and became useful. The sensor is mounted inside a drilled electrical conduit that acts as simple mechanical protection while still allowing the surrounding water level to reach the probe.
This is what the installation looked like once the probe and protective tube were in place:
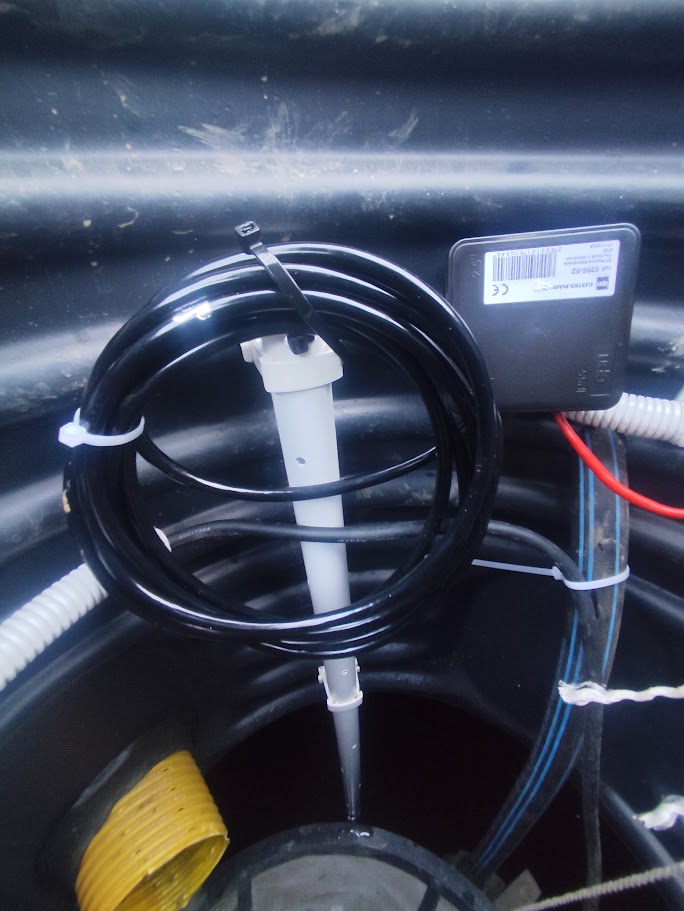
Why add 5.3 cm instead of displaying only the water column above the probe?
Because I want the Home Assistant entity to represent the actual height of the water surface measured from the physical bottom of the tank. The TL-136 measures pressure at its diaphragm. If that diaphragm is 5.3 cm above the bottom, the raw hydrostatic water column will always be 5.3 cm lower than the tape-measure reading from the bottom.
The region below the probe is not part of the active sensing range, and in practice that is acceptable because some sediment will eventually occupy the bottom zone anyway. For display and automation purposes, however, I still want the level entity to match the physical height from the bottom.
How ESPHome converts ADS1115 voltage into centimetres
The software calculation is deliberately transparent. It happens in three stages.
Stage 1 — convert ADS1115 voltage into loop current:
Stage 2 — convert current into the water column above the diaphragm:
The factor 6.25 is simply the 100 cm range divided by the 16 mA span between 4 and 20 mA:
Stage 3 — add the physical installation offset:
There is no hidden calibration algorithm here. The important part is that the resistor value, the probe range and the physical mounting offset all describe the same real installation.
Complete ESPHome YAML for the current build
The configuration below contains the whole measurement path used at this stage: ESP32, ADS1115 on A3, the 120 Ω shunt value, a median filter, current calculation, hydrostatic column height, actual level from the bottom, percentage, and the SSD1306 OLED. The display is rotated 180 degrees to match the physical orientation of my prototype. The large value is the tank percentage, with ADS1115 voltage and water-column height shown underneath as quick diagnostics.
full_level_cm constant can be changed without rebuilding the rest of the measurement logic.esphome:
name: sterownik-nawadniania
friendly_name: Irrigation Controller
esp32:
board: esp32dev
framework:
type: esp-idf
logger:
api:
encryption:
key: !secret api_encryption_key
ota:
- platform: esphome
password: !secret ota_password
wifi:
ssid: !secret wifi_ssid
password: !secret wifi_password
captive_portal:
web_server:
i2c:
sda: GPIO21
scl: GPIO22
scan: true
frequency: 50kHz
ads1115:
- address: 0x48
id: ads1115_1
sensor:
- platform: ads1115
ads1115_id: ads1115_1
multiplexer: A3_GND
gain: 4.096
sample_rate: 128
name: "TL136 Voltage"
id: tl136_voltage
unit_of_measurement: "V"
device_class: voltage
state_class: measurement
accuracy_decimals: 3
update_interval: 1s
filters:
- median:
window_size: 5
send_every: 1
send_first_at: 1
- platform: template
name: "TL136 Current"
id: tl136_current
unit_of_measurement: "mA"
state_class: measurement
accuracy_decimals: 2
update_interval: 1s
lambda: |-
if (isnan(id(tl136_voltage).state)) {
return NAN;
}
const float shunt_resistance = 120.0f;
float current_ma =
(id(tl136_voltage).state / shunt_resistance) * 1000.0f;
return current_ma;
- platform: template
name: "TL136 Water Column"
id: tl136_water_column
unit_of_measurement: "cm"
state_class: measurement
accuracy_decimals: 1
icon: "mdi:waves"
update_interval: 1s
lambda: |-
if (isnan(id(tl136_voltage).state)) {
return NAN;
}
const float shunt_resistance = 120.0f;
float current_ma =
(id(tl136_voltage).state / shunt_resistance) * 1000.0f;
float water_column_cm =
(current_ma - 4.0f) * 6.25f;
if (water_column_cm < 0.0f) {
water_column_cm = 0.0f;
}
if (water_column_cm > 100.0f) {
water_column_cm = 100.0f;
}
return water_column_cm;
- platform: template
name: "Tank Water Level"
id: tank_water_level
unit_of_measurement: "cm"
state_class: measurement
accuracy_decimals: 1
icon: "mdi:waves-arrow-up"
update_interval: 1s
lambda: |-
if (isnan(id(tl136_voltage).state)) {
return NAN;
}
const float shunt_resistance = 120.0f;
const float sensor_offset_cm = 5.3f;
float current_ma =
(id(tl136_voltage).state / shunt_resistance) * 1000.0f;
float water_column_cm =
(current_ma - 4.0f) * 6.25f;
if (water_column_cm < 0.0f) {
water_column_cm = 0.0f;
}
if (water_column_cm > 100.0f) {
water_column_cm = 100.0f;
}
float real_level_cm =
water_column_cm + sensor_offset_cm;
return real_level_cm;
- platform: template
name: "Tank Water Level Percent"
id: tank_water_percent
unit_of_measurement: "%"
state_class: measurement
accuracy_decimals: 0
icon: "mdi:water-percent"
update_interval: 1s
lambda: |-
if (isnan(id(tank_water_level).state)) {
return NAN;
}
const float full_level_cm = 100.0f;
float percent =
(id(tank_water_level).state / full_level_cm) * 100.0f;
if (percent < 0.0f) {
percent = 0.0f;
}
if (percent > 100.0f) {
percent = 100.0f;
}
return percent;
font:
- file: "gfonts://Roboto"
id: font_small
size: 10
- file: "gfonts://Roboto"
id: font_data
size: 11
- file: "gfonts://Roboto"
id: font_percent
size: 32
- file: "gfonts://Roboto"
id: font_medium
size: 14
display:
- platform: ssd1306_i2c
model: "SSD1306 128x64"
address: 0x3C
id: oled_display
rotation: 180°
update_interval: 2s
lambda: |-
if (
isnan(id(tank_water_percent).state) ||
isnan(id(tl136_voltage).state) ||
isnan(id(tl136_water_column).state)
) {
it.print(
64,
7,
id(font_small),
TextAlign::TOP_CENTER,
"TANK"
);
it.print(
64,
27,
id(font_medium),
TextAlign::TOP_CENTER,
"NO READING"
);
return;
}
it.print(
64,
0,
id(font_small),
TextAlign::TOP_CENTER,
"TANK"
);
it.printf(
64,
12,
id(font_percent),
TextAlign::TOP_CENTER,
"%.0f%%",
id(tank_water_percent).state
);
it.printf(
2,
52,
id(font_data),
TextAlign::TOP_LEFT,
"%.3fV",
id(tl136_voltage).state
);
it.printf(
126,
52,
id(font_data),
TextAlign::TOP_RIGHT,
"%.1fcm",
id(tl136_water_column).state
);
What Home Assistant receives from ESPHome
I intentionally expose more than one final “tank level” entity. During development, the intermediate values are extremely useful because they make it possible to decide whether a problem is electrical, mathematical or simply a sensor state.
Those entities are the diagnostic layer. Once the physical measurement was verified, I added a more visual dashboard rather than leaving the project as a list of numbers.
Building a proper Home Assistant dashboard for the tank
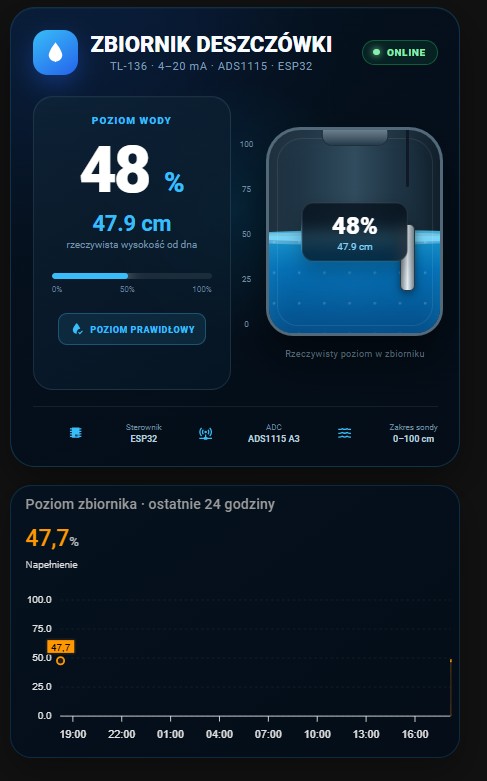
The main card combines the current percentage, real level in centimetres, a dynamically filled tank graphic and the diagnostic values from the TL-136 chain. A second card shows the last 24 hours of level history. That turns the measurement into something useful at a glance: I can see the current condition and also spot filling, consumption and future irrigation cycles.
I deliberately do not display litres yet. The tank is profiled rather than a simple rectangular box, so 50% of height does not necessarily mean 50% of volume. A trustworthy litre value needs either a manufacturer height-to-volume curve or my own calibration table.
Install
custom:button-card and custom:apexcharts-card. Button Card provides the dynamic tank visual and custom HTML/CSS/JavaScript, while ApexCharts Card provides the 24-hour history graph.How to add the card
Install Button Card and ApexCharts Card from HACS → Frontend, refresh the browser, edit the target dashboard, add a Manual card, and paste the YAML below.
The example uses entity IDs that correspond to the English ESPHome names in this article. Home Assistant can still generate different IDs depending on your device name, previous entities and naming history, so check Settings → Devices & services → Entities before assuming the five sensor.* IDs are identical on your system.
type: vertical-stack
cards:
# ==========================================================
# MAIN TANK CARD
#
# Requires:
# - custom:button-card
#
# If Home Assistant created different entity IDs, replace
# the five sensor.* entity IDs below.
# ==========================================================
- type: custom:button-card
entity: sensor.irrigation_controller_tank_water_level_percent
show_icon: false
show_name: false
show_state: false
tap_action:
action: more-info
hold_action:
action: more-info
styles:
card:
- padding: 0
- overflow: hidden
- border-radius: 24px
- border: 1px solid rgba(56, 189, 248, 0.22)
- background: >
linear-gradient(
145deg,
rgba(4, 16, 28, 0.98),
rgba(8, 28, 45, 0.98)
)
- box-shadow: >
0 18px 50px rgba(0, 0, 0, 0.28)
grid:
- grid-template-areas: '"tank"'
- grid-template-columns: 1fr
- grid-template-rows: auto
custom_fields:
tank:
- width: 100%
custom_fields:
tank: |
[[[
const percentEntity =
states['sensor.irrigation_controller_tank_water_level_percent'];
const levelEntity =
states['sensor.irrigation_controller_tank_water_level'];
const currentEntity =
states['sensor.irrigation_controller_tl136_current'];
const voltageEntity =
states['sensor.irrigation_controller_tl136_voltage'];
const columnEntity =
states['sensor.irrigation_controller_tl136_water_column'];
const unavailable = (e) =>
!e ||
e.state === 'unknown' ||
e.state === 'unavailable';
const n = (e, fallback = NaN) =>
unavailable(e) ? fallback : Number(e.state);
const percentRaw = n(percentEntity);
const level = n(levelEntity);
const current = n(currentEntity);
const voltage = n(voltageEntity);
const column = n(columnEntity);
const percent = Number.isFinite(percentRaw)
? Math.max(0, Math.min(100, percentRaw))
: 0;
const online = !unavailable(percentEntity);
let status = 'NO DATA';
let statusClass = 'status-offline';
if (online) {
if (percent <= 10) {
status = 'CRITICALLY LOW';
statusClass = 'status-critical';
} else if (percent <= 25) {
status = 'LOW';
statusClass = 'status-low';
} else if (percent < 90) {
status = 'LEVEL OK';
statusClass = 'status-normal';
} else if (percent < 100) {
status = 'ALMOST FULL';
statusClass = 'status-high';
} else {
status = 'FULL';
statusClass = 'status-full';
}
}
const fmt = (value, digits, unit) =>
Number.isFinite(value)
? `${value.toFixed(digits)} ${unit}`
: '—';
const updated =
percentEntity?.last_updated
? new Date(percentEntity.last_updated).toLocaleTimeString(
undefined,
{ hour: '2-digit', minute: '2-digit', second: '2-digit' }
)
: '—';
return `
<div class="rain-root">
<div class="rain-head">
<div>
<div class="rain-kicker">IRRIGATION CONTROLLER</div>
<div class="rain-title">Rainwater tank</div>
<div class="rain-subtitle">
TL-136 · 4–20 mA · ADS1115 · ESP32
</div>
</div>
<div class="rain-online ${online ? 'online' : 'offline'}">
<span class="rain-dot"></span>
${online ? 'ONLINE' : 'NO DATA'}
</div>
</div>
<div class="rain-main">
<div class="rain-left">
<div class="rain-value-label">WATER LEVEL</div>
<div class="rain-value">
${online ? Math.round(percent) : '—'}
<span>%</span>
</div>
<div class="rain-cm">
${fmt(level, 1, 'cm')}
</div>
<div class="rain-status ${statusClass}">
${status}
</div>
<div class="rain-progress">
<div
class="rain-progress-fill"
style="width:${percent}%"
></div>
</div>
<div class="rain-progress-scale">
<span>0%</span>
<span>100%</span>
</div>
</div>
<div class="rain-center">
<div class="tank-wrap">
<div class="tank-cap"></div>
<div class="tank-shell">
<div
class="tank-water"
style="height:${percent}%"
>
<div class="tank-wave tank-wave-one"></div>
<div class="tank-wave tank-wave-two"></div>
</div>
<div class="tank-scale">
<span style="bottom:95%">100</span>
<span style="bottom:72%">75</span>
<span style="bottom:48%">50</span>
<span style="bottom:24%">25</span>
<span style="bottom:1%">0</span>
</div>
<div class="tank-probe">
<div class="tank-probe-wire"></div>
<div class="tank-probe-body"></div>
</div>
<div class="tank-badge">
<strong>${online ? Math.round(percent) : '—'}%</strong>
<span>${fmt(level, 1, 'cm')}</span>
</div>
</div>
<div class="tank-base"></div>
</div>
</div>
<div class="rain-right">
<div class="diag-title">TL-136 DIAGNOSTICS</div>
<div class="diag-row">
<span>Loop current</span>
<strong>${fmt(current, 2, 'mA')}</strong>
</div>
<div class="diag-row">
<span>ADS1115 voltage</span>
<strong>${fmt(voltage, 3, 'V')}</strong>
</div>
<div class="diag-row">
<span>Water column</span>
<strong>${fmt(column, 1, 'cm')}</strong>
</div>
<div class="diag-row">
<span>Probe offset</span>
<strong>5.3 cm</strong>
</div>
<div class="diag-row">
<span>ADC input</span>
<strong>A3</strong>
</div>
<div class="diag-row">
<span>Updated</span>
<strong>${updated}</strong>
</div>
</div>
</div>
<div class="rain-foot">
<span>ESP32</span>
<span>ADS1115 · 0x48</span>
<span>OLED · 0x3C</span>
<span>TL-136 · 0–1 m</span>
</div>
</div>
`;
]]]
extra_styles: |
.rain-root {
box-sizing: border-box;
width: 100%;
padding: 24px;
color: #eaf6ff;
font-family:
Inter,
-apple-system,
BlinkMacSystemFont,
"Segoe UI",
sans-serif;
}
.rain-head {
display: flex;
align-items: flex-start;
justify-content: space-between;
gap: 18px;
margin-bottom: 24px;
}
.rain-kicker {
color: #38bdf8;
font-size: 11px;
font-weight: 800;
letter-spacing: 0.18em;
}
.rain-title {
margin-top: 5px;
color: #ffffff;
font-size: clamp(24px, 4vw, 36px);
line-height: 1.05;
font-weight: 800;
}
.rain-subtitle {
margin-top: 7px;
color: #85a8be;
font-size: 13px;
}
.rain-online {
display: flex;
align-items: center;
gap: 8px;
padding: 8px 12px;
border-radius: 999px;
font-size: 11px;
font-weight: 800;
letter-spacing: 0.06em;
white-space: nowrap;
}
.rain-online.online {
color: #86efac;
background: rgba(34, 197, 94, 0.10);
border: 1px solid rgba(34, 197, 94, 0.34);
}
.rain-online.offline {
color: #fca5a5;
background: rgba(239, 68, 68, 0.10);
border: 1px solid rgba(239, 68, 68, 0.32);
}
.rain-dot {
width: 8px;
height: 8px;
border-radius: 50%;
background: currentColor;
box-shadow: 0 0 12px currentColor;
}
.rain-main {
display: grid;
grid-template-columns:
minmax(190px, 0.85fr)
minmax(220px, 1.15fr)
minmax(210px, 0.95fr);
gap: 18px;
align-items: stretch;
}
.rain-left,
.rain-right {
box-sizing: border-box;
min-width: 0;
padding: 18px;
border: 1px solid rgba(148, 191, 218, 0.15);
border-radius: 18px;
background: rgba(255,255,255,0.025);
}
.rain-left {
display: flex;
flex-direction: column;
justify-content: center;
}
.rain-value-label,
.diag-title {
color: #38bdf8;
font-size: 12px;
font-weight: 800;
letter-spacing: 0.09em;
}
.rain-value {
margin-top: 12px;
color: #ffffff;
font-size: clamp(54px, 8vw, 86px);
line-height: 0.95;
font-weight: 850;
letter-spacing: -0.04em;
}
.rain-value span {
margin-left: 3px;
color: #7dd3fc;
font-size: 0.45em;
font-weight: 800;
}
.rain-cm {
margin-top: 10px;
color: #7dd3fc;
font-size: 22px;
font-weight: 750;
}
.rain-status {
align-self: flex-start;
margin-top: 14px;
padding: 7px 10px;
border-radius: 9px;
font-size: 10px;
font-weight: 850;
letter-spacing: 0.07em;
}
.status-critical {
color: #fecaca;
background: rgba(239,68,68,0.16);
}
.status-low {
color: #fed7aa;
background: rgba(249,115,22,0.15);
}
.status-normal {
color: #bae6fd;
background: rgba(14,165,233,0.14);
}
.status-high {
color: #a5f3fc;
background: rgba(6,182,212,0.15);
}
.status-full {
color: #bbf7d0;
background: rgba(34,197,94,0.15);
}
.status-offline {
color: #cbd5e1;
background: rgba(148,163,184,0.12);
}
.rain-progress {
height: 9px;
margin-top: 20px;
overflow: hidden;
border-radius: 999px;
background: rgba(255,255,255,0.08);
}
.rain-progress-fill {
height: 100%;
border-radius: inherit;
background:
linear-gradient(
90deg,
#0284c7,
#38bdf8,
#67e8f9
);
box-shadow: 0 0 18px rgba(56,189,248,0.45);
transition: width 0.8s ease;
}
.rain-progress-scale {
display: flex;
justify-content: space-between;
margin-top: 6px;
color: #66869a;
font-size: 10px;
}
.rain-center {
display: flex;
align-items: center;
justify-content: center;
min-height: 330px;
padding: 6px 0;
}
.tank-wrap {
position: relative;
width: min(100%, 300px);
height: 325px;
}
.tank-cap {
position: absolute;
z-index: 4;
left: 50%;
top: 0;
width: 95px;
height: 22px;
transform: translateX(-50%);
border-radius: 12px 12px 4px 4px;
border: 1px solid rgba(148,191,218,0.32);
background:
linear-gradient(
180deg,
rgba(94,123,141,0.85),
rgba(25,47,60,0.95)
);
}
.tank-shell {
position: absolute;
z-index: 2;
left: 6%;
right: 6%;
top: 17px;
bottom: 16px;
overflow: hidden;
border: 2px solid rgba(159,199,222,0.42);
border-radius: 38px 38px 30px 30px;
background:
linear-gradient(
180deg,
rgba(172,202,219,0.16),
rgba(83,117,135,0.06)
);
box-shadow:
inset 0 0 35px rgba(255,255,255,0.05),
0 18px 42px rgba(0,0,0,0.25);
}
.tank-water {
position: absolute;
z-index: 1;
left: 0;
right: 0;
bottom: 0;
min-height: 0;
background:
linear-gradient(
180deg,
rgba(56,189,248,0.72),
rgba(2,132,199,0.85) 38%,
rgba(3,105,161,0.95)
);
box-shadow:
inset 0 10px 25px rgba(103,232,249,0.30);
transition: height 0.9s ease;
}
.tank-wave {
position: absolute;
left: -30%;
width: 160%;
height: 26px;
border-radius: 45%;
background: rgba(165,243,252,0.34);
}
.tank-wave-one {
top: -11px;
animation: waveOne 7s linear infinite;
}
.tank-wave-two {
top: -7px;
opacity: 0.45;
animation: waveTwo 11s linear infinite reverse;
}
@keyframes waveOne {
from { transform: translateX(-9%) rotate(0deg); }
50% { transform: translateX(7%) rotate(1deg); }
to { transform: translateX(-9%) rotate(0deg); }
}
@keyframes waveTwo {
from { transform: translateX(8%); }
50% { transform: translateX(-8%); }
to { transform: translateX(8%); }
}
.tank-scale {
position: absolute;
z-index: 5;
left: 11px;
top: 12px;
bottom: 12px;
width: 36px;
color: rgba(225,244,255,0.58);
font-size: 9px;
}
.tank-scale span {
position: absolute;
left: 0;
}
.tank-scale span::after {
content: "";
position: absolute;
left: 23px;
top: 50%;
width: 12px;
border-top: 1px solid rgba(225,244,255,0.35);
}
.tank-probe {
position: absolute;
z-index: 5;
right: 33px;
top: 20px;
bottom: 17px;
width: 20px;
}
.tank-probe-wire {
position: absolute;
left: 9px;
top: 0;
width: 2px;
height: 62%;
background: rgba(203,213,225,0.75);
}
.tank-probe-body {
position: absolute;
left: 4px;
bottom: 26%;
width: 12px;
height: 58px;
border-radius: 7px;
border: 1px solid rgba(255,255,255,0.50);
background:
linear-gradient(
90deg,
#64748b,
#e2e8f0,
#64748b
);
}
.tank-badge {
position: absolute;
z-index: 6;
left: 50%;
top: 50%;
display: flex;
min-width: 86px;
transform: translate(-50%, -50%);
flex-direction: column;
align-items: center;
padding: 10px 13px;
border: 1px solid rgba(125,211,252,0.35);
border-radius: 12px;
background: rgba(5,20,33,0.74);
backdrop-filter: blur(6px);
box-shadow: 0 10px 30px rgba(0,0,0,0.28);
}
.tank-badge strong {
color: #ffffff;
font-size: 24px;
}
.tank-badge span {
margin-top: 2px;
color: #9bdcfb;
font-size: 12px;
}
.tank-base {
position: absolute;
z-index: 1;
left: 11%;
right: 11%;
bottom: 6px;
height: 18px;
border-radius: 50%;
background: rgba(56,189,248,0.10);
filter: blur(5px);
}
.rain-right {
display: flex;
flex-direction: column;
justify-content: center;
}
.diag-title {
margin-bottom: 8px;
}
.diag-row {
display: flex;
align-items: center;
justify-content: space-between;
gap: 14px;
padding: 12px 0;
border-bottom: 1px solid rgba(148,191,218,0.11);
font-size: 12px;
}
.diag-row:last-child {
border-bottom: 0;
}
.diag-row span {
color: #8ba9bb;
}
.diag-row strong {
color: #eaf6ff;
text-align: right;
}
.rain-foot {
display: flex;
flex-wrap: wrap;
gap: 8px 16px;
margin-top: 18px;
padding-top: 14px;
border-top: 1px solid rgba(148,191,218,0.12);
color: #68889a;
font-size: 10px;
letter-spacing: 0.05em;
}
@media (max-width: 860px) {
.rain-root {
padding: 18px;
}
.rain-main {
grid-template-columns: 1fr;
}
.rain-center {
order: -1;
min-height: 300px;
}
.tank-wrap {
height: 290px;
}
}
@media (max-width: 520px) {
.rain-head {
flex-direction: column;
}
.rain-online {
align-self: flex-start;
}
.rain-center {
min-height: 270px;
}
.tank-wrap {
height: 265px;
}
.rain-value {
font-size: 58px;
}
}
# ==========================================================
# WATER LEVEL HISTORY — LAST 24 HOURS
#
# Requires:
# - custom:apexcharts-card
# ==========================================================
- type: custom:apexcharts-card
graph_span: 24h
header:
show: true
title: "Water level — last 24 hours"
show_states: true
colorize_states: true
yaxis:
- min: 0
max: 100
decimals: 0
apex_config:
chart:
height: 230
grid:
borderColor: "rgba(148, 191, 218, 0.14)"
stroke:
curve: smooth
fill:
type: gradient
gradient:
shadeIntensity: 0.25
opacityFrom: 0.45
opacityTo: 0.05
tooltip:
x:
format: "dd.MM HH:mm"
series:
- entity: sensor.irrigation_controller_tank_water_level_percent
name: "Level"
type: area
curve: smooth
stroke_width: 3
group_by:
duration: 5min
func: avg
What the dashboard is doing
The central tank is not a static PNG. It is built inside custom:button-card with HTML and CSS, and the water fill height is driven directly by the percentage entity. At 48%, the blue section occupies roughly 48% of the graphic. The real level in centimetres and the raw measurement values remain visible next to it, so the attractive UI does not hide the diagnostics.
The status logic is intentionally simple at this stage. Up to 10% is marked critically low, up to 25% low, the middle operating range is shown as normal, and the upper range is shown as almost full or full. These are currently interface thresholds rather than final pump-control thresholds; later they can be tied into the actual irrigation safety logic.
The second card plots the last 24 hours. I group the data into five-minute intervals because a rainwater tank does not need a graph point every second. That makes the trend easier to read and will later make rainfall, irrigation consumption and tank drawdown obvious.
a displayed value such as 48% is currently a percentage of the working height because ESPHome is temporarily configured with 100 cm = 100%. It must not yet be interpreted as 48% of the nominal 3000-litre volume.
The SSD1306 OLED is useful, but it is not the final interface
The 0.96-inch OLED is extremely handy while the controller is being built. In my enclosure orientation it is rotated 180 degrees in software. The large centre value is the filling percentage, while the lower line shows ADS1115 voltage and water-column height. That means I can inspect both the final result and two diagnostic values without opening Home Assistant.
The long-term controller will use a colour TFT touchscreen. The plan is to show tank level, pump state, irrigation zones, manual and automatic modes, sensor status, warnings and local controls on one interface that still works without reaching for a phone.
What I learned while bringing the prototype up
The most useful debugging decision was to test the chain in layers. If the probe, shunt, ADC, OLED, ESP32 and Home Assistant are all connected before the first measurement, every failure looks like the same problem. Separating the stages makes the fault domain much smaller.
My preferred sequence is: verify the shunt resistance, measure voltage across the shunt, verify the ADS1115 3.3 V supply, scan I²C, check the selected ADS channel, and only then start questioning formulas or YAML. If a multimeter sees a sensible voltage at the measurement node while ESPHome reports almost zero, the problem is no longer the hydrostatic probe itself.
The A0 detour is a good example. In this build I did not get a useful result from A0, so I moved the measurement to A3. With A3_GND configured, the ADC reading became stable and the rest of the project could continue.
1) measure the shunt, 2) measure the voltage across it, 3) verify 3.3 V at the ADS1115, 4) run an I²C scan, 5) check the voltage on the selected ADS input, 6) only then inspect the formulas and YAML.
Do I need a 0.1% precision resistor?
Not for this application. A single 120 Ω resistor with a sensible tolerance is enough, especially when the actual measurement system is later validated against a physical water height. At 20 mA the resistor dissipates only about 0.048 W, so an ordinary 0.25 W resistor has plenty of power margin.
For the finished controller, consistency matters more than buying an unnecessarily high-wattage resistor: the hardware value and the value used in ESPHome must describe the same input stage.
Can tank height be converted directly into litres?
Not honestly — at least not yet.
The tank is nominally 3000 litres, but its body is profiled rather than a rectangular prism. That means half the measured height does not automatically equal 1500 litres. To display litres with any confidence I need either the manufacturer’s height-versus-volume characteristic or an empirical calibration table for this exact tank.
For now Home Assistant displays values I can defend: centimetres and a working height percentage. A litre estimate will only be added when there is a sound conversion behind it.
Where the irrigation controller goes from here
Water level is only the first real sensor in a much larger controller. The next stages are valve outputs, pump control, minimum-level lockout, manual and automatic irrigation modes, and eventually additional measurements such as pressure or flow.
The ADS1115 still has unused channels, which leaves room for more analogue signals — for example another 4–20 mA transmitter. A pulse-output flow meter would be connected to a GPIO rather than the ADS1115. If I eventually need more analogue channels, additional ADS1115 devices can share the local I²C bus at different addresses. The important word there is local: I do not intend to run I²C across the 15-metre garden cable.
The final version will also need a cleaner enclosure and proper protection for wiring that leaves the controller and goes outdoors. A long cable buried in a garden is a very different electrical environment from 10 cm of Dupont wire on a workbench.
Conclusion
The useful part of this project is not that Home Assistant can display a blue tank graphic. The useful part is that every number in that graphic comes from a measurement chain that can be followed from the water pressure all the way back to a multimeter and a tape measure.
The TL-136 provides a robust 4–20 mA signal, the 120 Ω shunt turns it into a practical voltage range, the ADS1115 digitises it, the ESP32 converts it into engineering units, and ESPHome publishes both the final level and the intermediate diagnostic values. The 5.3 cm installation offset then makes the Home Assistant level correspond to the physical tank bottom instead of the sensor diaphragm.
That is the foundation I wanted before adding pump and valve automation. Once the level measurement is trustworthy, the rest of the irrigation logic can make decisions based on something more meaningful than a timer.
Turning the level monitor into a real irrigation controller.
The OLED remains a development display for now; the finished controller is planned around a colour TFT touchscreen and will eventually combine tank level, pump logic, irrigation zones and local control.
Technical references used to verify the configuration
The configuration was checked against ESPHome documentation for ADS1115 (I²C addressing, A3_GND, gain, sample rate and analogue-input behaviour) and SSD1306. The dashboard section uses the documented custom fields, HTML/CSS and JavaScript templating capabilities of custom:button-card together with historical series and grouping from ApexCharts Card. The TL-136 details and practical values described here come from the markings on the physical probe used in the build and from the measurements performed during the project.